Oracle 10g New Features: Easy Management
This article focuses on the new features aimed at database management. Self-management, or easy management, has been the key word for Oracle 10g. The main areas of enhancements are:
- Self-Managing Database
- Simplified Configuration of Shared Servers
- Transaction Manageability
- Simplified Statistics Collection
- Extended Support for FGA (Fine Grain Audit)
- Response File Creation during database install
Simplified Configuration of Shared Servers - The configuration of shared servers and their associated dispatchers has been largely made dynamic.
Transaction Manageability - Now, we can monitor normal transaction rollback or transactions recovered by SMON. In addition, we can view historical information about transaction recovery and transaction rollback. Also, Oracle 10g pre-configures objects for maximum concurrency.
Simplified Statistics Collection - Beginning with the 10g version, both the real and fixed dictionary tables need to be analyzed in order to get better performance. There are several new procedures that have been introduced to streamline and simplify the compute statistics operation of dictionary objects.
Extended Support for FGA (Fine Grain Audit) - There is now additional fine grain audit support for 'insert', 'delete', and 'update' statements.
Response File Creation during database install - With Oracle Database 10g you now have true silent capability. When running OUI in silent mode on a character mode console, you no longer need to specify an X-server or set the DISPLAY environment variable on UNIX. No GUI classes are instantiated.
Self-Managing Database
Generally speaking, database administration primarily entails regular health checks, handling the performance issues, organizing periodic monitoring activities, and locating the bottlenecks. Checking the space thresholds, creating indexes, allocating necessary resources, collecting statistics etc. are the other important activities.
The Oracle 10g database release takes over many of these tedious database tasks and tuning processes. The collection, storage, and analysis of status information about the database and the host has become relatively easy. Many new features have been added to aid self-management and self-tuning. This section focuses on database manageability features newly introduced and enhanced.
Overview
The Oracle 10g database introduces a new framework for managing many tuning tasks automatically, for producing real-time information about the database's health, and for extending advisories to improve performance.
The new manageability infrastructure mainly focuses on four areas. They are as follows:
- - Automatic Workload Repository - The ability to automatically collect and store database information at regular intervals is crucial. This information should be persistent and accurate. Oracle introduces a new internal data store called Automatic Workload Repository (AWR) to collect and store data. AWR is central to the whole framework of self and automatic management. It works with internal Oracle database components to process, maintain, and access performance statistics for problem detection and self-tuning.
- Automatic Database Diagnostic Monitor - The second key component is the advisory framework that provides expert recommendations to improve performance. The Automatic Database Diagnostic Monitor (ADDM) is a server-based performance expert in a box. It can perform real time root cause analysis of performance issues. It relies on the current statistics within the SGA and on the contents of the AWR. In addition, there are various advisory tools to help make tuning decisions.
- Next, are the Automatic Routine Administration tasks. By using the newly introduced Scheduler, you can delegate to the Oracle database some of the repetitive tasks that need to be performed to keep the database up-to-date.
- Server Generated Alerts - Oracle Database 10g is capable of automatically detecting many database alarm situations.
We have covered the topic of the Scheduler in Chapter 10, Utilities Improvements. We will examine the other features next.
Automatic Workload Repository (AWR)
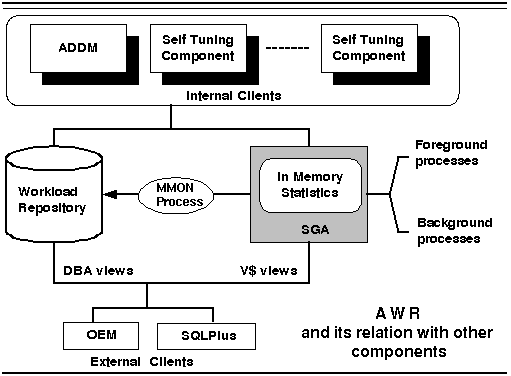
AWR is the main infrastructure that collects in-memory statistics at regular intervals and makes them available to the internal and external services or clients. External clients, such as Oracle Enterprise Manager and SQL*plus sessions, can view the AWR information through the data dictionary views. Internal clients, such as the ADDM and other self-tuning components or advisories, make use of the contents in the AWR.
General Benefits
Advantages of the new workload repository include:
- AWR is a record of all database in-memory statistics historically stored. In the past, historical data could be obtained manually using the 'statspack' utility. AWR automatically collects more precise and granular information than past methods.
- With a larger data sample, more informed decisions could be made. The self-tuning mechanism uses this information for trend analysis.
- The statistics survive database reboots and crashes.
- Another benefit is that AWR statistics are accessible to external users, who can build their own performance monitoring tools, routines, and scripts.
Oracle recommends that statspack users switch to the Workload Repository in Oracle Database 10g.
Physical Structures
AWR is stored in tables owned by 'SYS', but physically located on the SYSAUX tablespace. The Workload Repository contains two types of tables:
- Metadata Tables: These are used to control, process, and describe the Workload Repository tables. For example, Oracle uses the metadata tables to determine when to perform snapshots, and what to capture to disk.
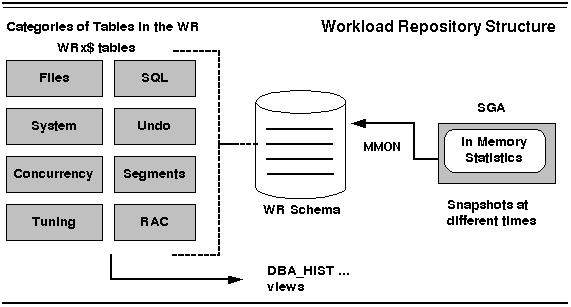
Historical Statistics Tables: These tables store historical statistical information about the database in the form of snapshots. Each snapshot is a capture of the in-memory database statistics data at a certain point in time. All names of the AWR tables are prefixed with WRx$ with x specifying the kind of table:
- - WRM$ tables store metadata information for the Workload Repository.
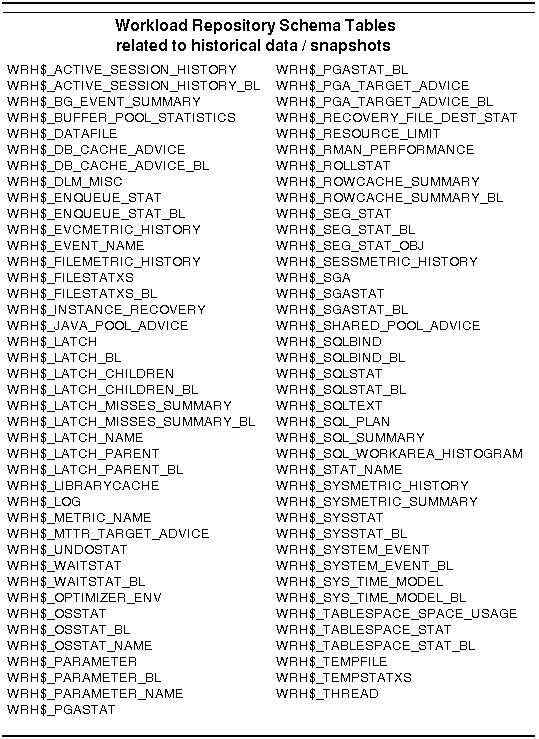
- WRH$ tables store historical data or snapshots.
- WRI$ tables store data related to advisory functions.
The WRx$ tables are organized into the following categories: File Statistics, General System Statistics, Concurrency Statistics, Instance Tuning Statistics, SQL Statistics, Segment Statistics, Undo Statistics, Time- Model Statistics, Recovery Statistics, and RAC Statistics. Fig 9.1 shows a graphical view of the AWR table types.
Following is the list of WRM$ tables that control all repository operations:
WRM$_BASELINE
WRM$_DATABASE_INSTANCE
WRM$_SNAPSHOT
WRM$_SNAP_ERROR
WRM$_WR_CONTROL
 Figure 9.1 Automatic Workload Repository (AWR) Structures
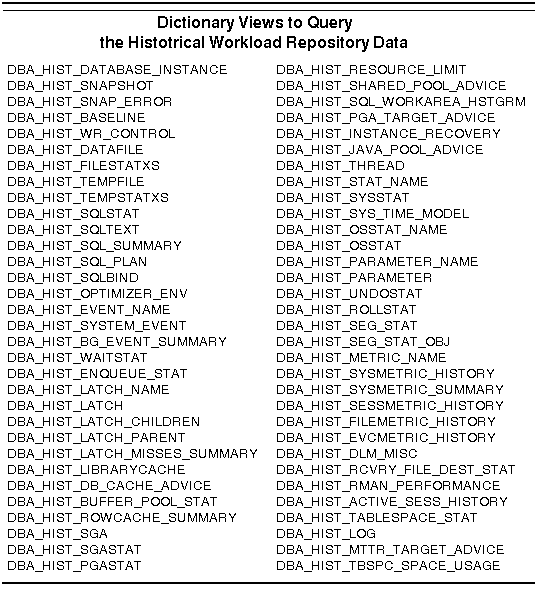
Dictionary views are also provided, making the historical data available to users for query. Any view related to the historical information in the AWR has the dba_hist_ prefix. Figures 9.2 and 9.3 show the full list of the WR tables and the dba_hist* tables respectively.
Collection Process
The collection process involves the capture of in-memory statistics from the SGA and their transfer to the physical tables located in the workload repository. The new background process, MMON, does this. The frequency of the capture snapshot is 30 minutes by default, however it can be adjusted suitably.
You can control the interval and retention of snapshot generation by the dbms_workload_repository.modify_snapshot_settings procedure. For example:
EXEC DBMS_WORKLOAD_REPOSITORY.MODIFY_SNAPSHOT_SETTINGS (43200, 15);
In this example, the retention period is specified as 30 days (43200 min) and the interval between each snapshot is 15 min.
NOTE: Taking manual snapshots is also supported in conjunction with the automatic snapshots that the system generates. For this, the dbms_workload_repository.create_snapshot procedure is used.
The snapshots are used for computing the rate of change of a statistic. This is mainly used for performance analysis. A snapshot sequence numer (snap_id) identifies each snapshot, which is unique within the Workload Repository. Figure 9.4 shows the relation of AWR to other components.
 Figure 9.2 Workload Repository Tables
 Figure 9.3 Dictionary Views exposing the historical workload repository
The statistics_level initialization parameter controls the type of statistics collected and stored. The parameter can take any one of these values:
- - basic: The computation of AWR statistics and metrics is turned off.
- typical: Only a part of the statistics are collected. They are normally enough to monitor the Oracle database behavior.
- all: All possible statistics are captured.
 Figure 9.4 AWR and relation with components
Types of Data Collected
The collected statistics include:
- - New time model statistics that show the amount of time spent on database activities.
- Object Statistics that determine both access and usage of the segments.
- Some selected statistics collected in v$sysstat and v$sesstat.
- Some of the optimizer statistics that include statistics for self-learning and tuning.
- The ADDM Active Session History (ASH), which represents the history of the recent session's activity.
These statistics can be broadly categorized into 5 groups based on their nature.
- - Base Statistics - This group represents raw data, which are generally values from the start of the database, e.g. total physical reads.
- SQL Statistics - Important measurements regarding the SQL statement. For example: Disk Read per SQL statement.
- Metrics - These are the secondary statistics, and the most interesting ones from a tuning point of view. Metrics track the rates of change of activities in the database. For example, the average physical reads in the system in the last 30 min. is a metric.
- Contents of Active Session History - For example, db file sequential read wait for SID of 16, file# 12, block# 1245, obj# 67, and time: 20000us.
- Advisor Results - Results of the expert analysis by the advisor framework.
Note on Metrics
As we noted above, the Metrics are the statistics derived from base statistics. They represent the delta values between the snapshot periods. Metrics are used by internal components (clients) for system health monitoring, problem detection and self-tuning.
Metrics are a key component in tracking threshold violations and thus for generating alerts. Since Metrics are pre-computed internally, they are readily available for use. Metrics are very useful in understanding the load and the nature of activity between two specified time periods.
A unique number, which is referred to as a metric number, identifies metrics. Each metric is also associated with a metric name. You can query the view v$metricname to find the names of all the metrics. For example:
SQL> select METRIC_NAME, METRIC_UNIT from v$metricname;
NOTE: Internally, MMON periodically updates metric data from the corresponding base statistics.
There are about 183 metrics for which you can define thresholds. Examples of metrics:
Physical Reads Per Sec
User Commits Per Sec
SQL Service Response Time
DB Block Changes Per Txn
Redo Generated Per Sec
Physical Writes Per Sec
Tablespace Space Usage
Network Traffic Volume Per Sec
Logical Reads Per Sec
CR Blocks Created Per Sec
Using and Managing AWR
You can query base statistics and metrics from the various fixed views provided. You can optionally create your own snapshots and baselines using the dbms_workload_repository package.
dbms_workload_repository package procedures are as follows:
- - modify_snapshot_settings: Procedure to modify the snapshot settings.
- drop_baseline: Procedure to drop a single baseline.
- create_baseline: Procedure to create a single baseline.
- drop_snapshot_range: Procedure to drop a range of snapshots.
- create_snapshot: Procedure to create a manual snapshot immediately.
You can use the Oracle-provided SQL scripts to generate reports to view the contents of AWR.
- - swrfrpt.sql: This script generates a report showing information on the overall behavior of the system over a time period. The script generates a text file.
- swrfrpth.sql: This script gives the same information as swrfrpt.sql, however, the generated output file uses HTML format.
Active Session History
The Active Session History (ASH) represents the history of a recent session's activity. ASH facilitates the analysis of the system performance at the current time. ASH is composed of regular samples of information extracted from v$session. ASH is designed as a rolling buffer in memory, and earlier information is overwritten when needed. ASH uses the memory of the SGA.
NOTE: It is also possible to access ASH through SQL*plus by querying v$active_session_history. This view contains one row for each active session per sample.
Database Feature Usage Metrics
AWR is also used to track database usage metrics. The usage metrics represent how you use the database features. The database usage metrics are divided into two categories:
- - The database feature usage statistics.
- The High Water Mark (HWM) values of certain database attributes.
Database Feature Usage Statistics include Advanced Replication, Oracle Streams, AQ, Virtual Private Database, Audit options etc.
High Water Mark Statistics include the size of the largest segment, the maximum number of sessions, the maximum number of tables, the maximum size of the database, the maximum number of data files, etc.
To view usage metric information, you can query the following:
- - dba_feature_usage_statistics - Lists the usage statistics of various database features.
- dba_high_water_mark_statistics - Lists the database high water mark statistics
The above is an excerpt from the bestselling Oracle10g book Oracle Database 10g New Features by Mike Ault, Madhu Tumma and Daniel Liu, published by Rampant TechPress.
- admin's blog
- Log in to post comments
